 1136091600
GNU General Public License
You may share exact copies of this work as long as you credit the original author and provide a link to the license. Changing the item is not allowed under this license.
Citation
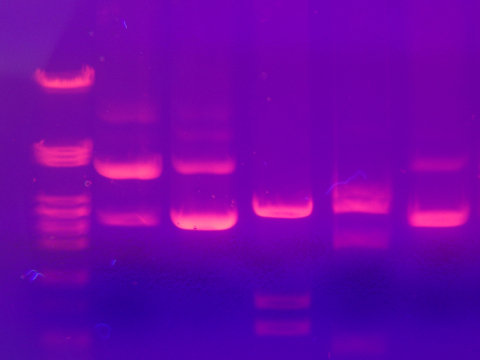
Mnolf. File:Gel electrophoresis 2.jpg. April 4, 2006. Photograph. Wikimedia Commons. Accessed February 20, 2026.